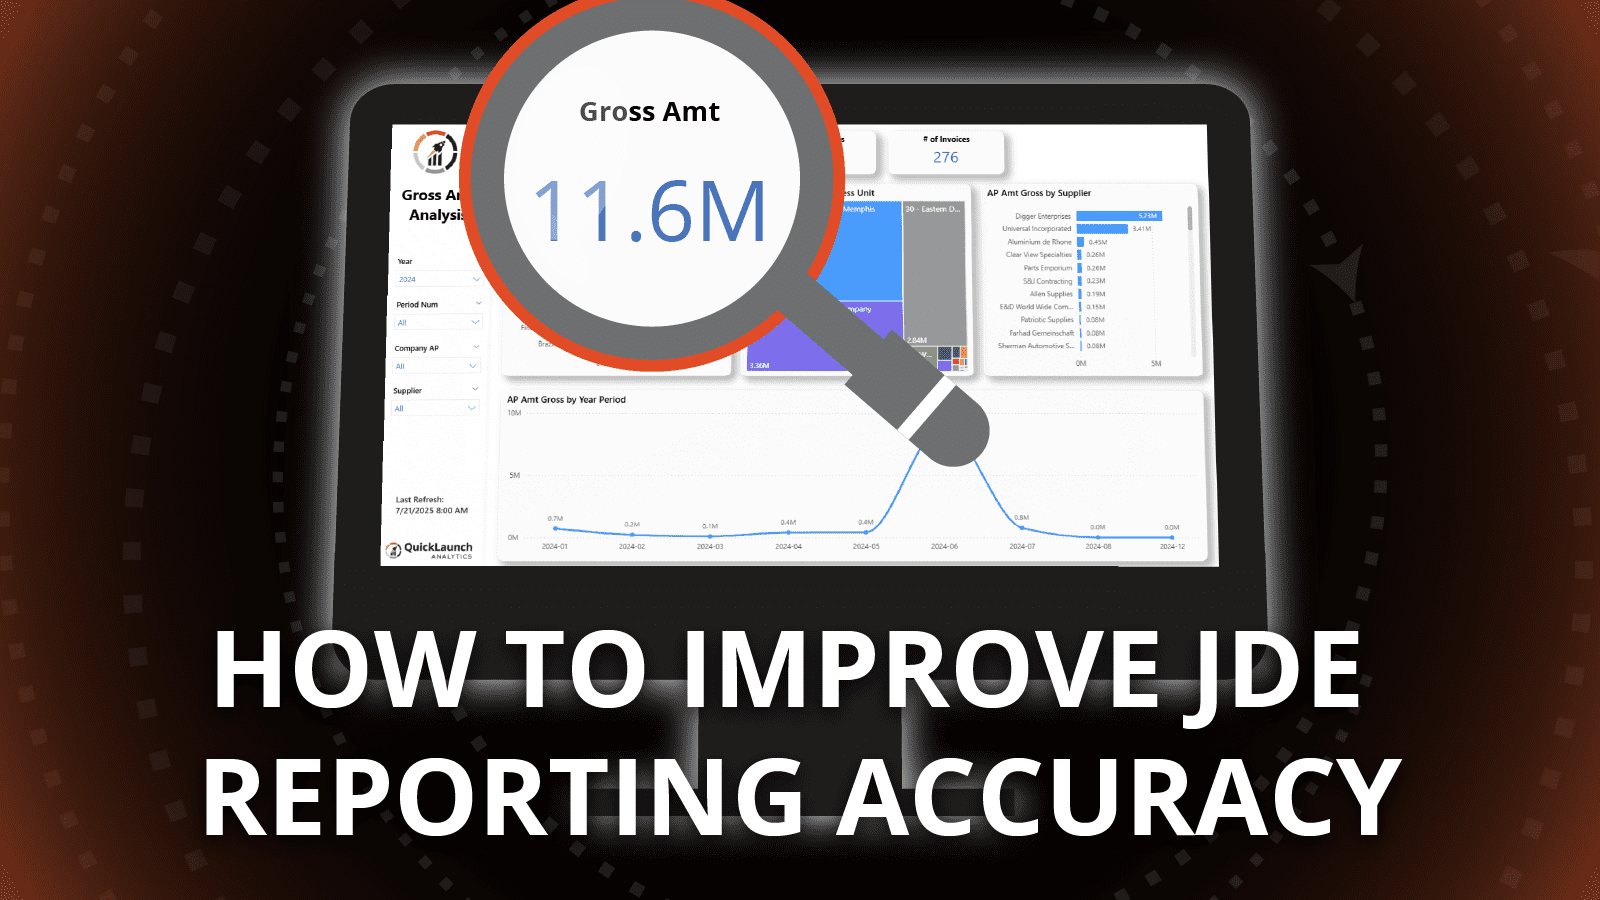
If your finance team still spends the first week of every month reconciling spreadsheets and arguing over whose numbers are correct, you’re not alone.
JDE financial analysis presents unique challenges that most organizations underestimate, and the consequences show up in delayed month-end closes, reporting errors, and executive meetings derailed by debates about data accuracy. The good news? These problems have solutions, and understanding them starts with recognizing what makes JD Edwards analytics fundamentally different from other enterprise systems.
━━━━━━━━━━━━━━━━━━━━
Why JDE Financial Analysis Demands a Different Approach
JD Edwards was engineered for transactional excellence, not analytical clarity. A proper JDE financial analysis suite bridges this gap by translating transactional data into decision-ready insights.
Every time someone enters a purchase order, processes an invoice, or posts a journal entry, JDE captures that transaction with precision. But when your CFO asks for a consolidated view of gross margin by product line, the system’s design creates obstacles that standard business intelligence tools can’t navigate without specialized knowledge.
The Technical Reality:
The architecture of JD Edwards includes over 6,000 interconnected tables with complex relationships that even experienced database administrators find challenging. Financial data lives in tables with names like:
- F0901 (the Account Master)
- F0911 (the General Ledger or Account Ledger)
- Field names such as GBMCU representing Business Unit
Without proper translation, your finance team would need to memorize these codes just to pull a basic trial balance.
This technical complexity explains why so many JDE financial analysis projects fail. Organizations invest in Power BI or other visualization tools, connect them directly to their JD Edwards database, and expect JD Edwards finance insights to flow naturally. Instead, they get raw data that requires extensive manual manipulation before it becomes useful.
━━━━━━━━━━━━━━━━━━━━
The Hidden Challenges in JDE Reporting Accuracy
When finance leaders talk about improving reporting accuracy, they typically focus on the visible problems: numbers that don’t match between systems, reports that take too long to generate, and analyses that require too much manual intervention.
But the root causes of poor ERP financial reporting run deeper than most realize.
Three Critical Data Accuracy Pitfalls:
1. Julian Date Storage
JD Edwards stores dates as Julian integers rather than standard calendar dates. A date that should appear as January 1, 2024 shows up as 124001 in the database.
The Impact: Power BI’s time intelligence features, which handle year-over-year comparisons and rolling averages, simply don’t work with this format. Your analysts end up building custom workarounds that break when edge cases appear, like century transitions or leap years.
2. Decimal Precision Issues
JDE stores numeric values without decimal points, relying on data dictionary codes to determine placement. A stored value of 123456 might represent:
- $1,234.56 with two decimals
- $12.3456 with four decimals
- 123,456 Yen with zero decimals
The Impact: Get this wrong, and an invoice of $1,234.56 displays as $123,456.00 in your reports. Your users lose trust in the entire analytics platform, and rightfully so.
3. User Defined Codes (UDCs)
The system uses thousands of internal reference codes to represent everything from payment terms to account categories.
The Impact: When your accounts receivable report shows payment term code “03” instead of “Net 30 Days,” the information becomes useless for business decision-making.
━━━━━━━━━━━━━━━━━━━━
Building a Foundation for Accurate Financial Reporting
Solving these challenges requires a systematic approach that addresses data transformation, business logic, and governance simultaneously. Organizations that succeed with JDE financial analysis typically follow a common pattern.
The Two-Part Foundation:
1 Establish a Proper Data Foundation
This means implementing a staging layer, often using a modern data lakehouse architecture, where all the necessary conversions happen before data reaches Power BI:
- Julian dates get transformed into standard calendar dates
- Decimal precision codes get interpreted correctly
- UDC values get replaced with meaningful business descriptions
By the time data arrives in your visualization layer, it looks and behaves like information your finance team can actually use.
2 Standardize Your Calculations
Without centralized business logic, different departments inevitably create conflicting metrics:
Finance calculates gross margin one way, while sales uses a different formula. The CFO sees revenue figures that don’t match what the VP of Sales presented last week.
These “meeting math” debates consume executive time and erode confidence in your data.
The Solution:
Implementing pre-built, validated formulas for all critical financial metrics. Whether you need EBITDA, working capital ratios, or inventory turnover, everyone in the organization should see the same calculation applied consistently across all reports and dashboards.
━━━━━━━━━━━━━━━━━━━━
Multi-Calendar Functionality and Time Intelligence
Different departments within your organization likely operate on different calendars:
- Finance follows fiscal periods
- Retail operations might use a 4-4-5 calendar
- Manufacturing sticks to standard months
When executives ask for “Q2 performance,” each department interprets that request differently.
Effective JDE financial analysis requires building calendar structures that accommodate these variations. Your analytics platform should handle the conversion automatically, allowing users to toggle between different calendar perspectives while maintaining accurate comparisons.
This becomes particularly important for year-over-year trending. Standard Power BI time intelligence functions assume standard calendar formatting. They fail when dates aren’t properly converted from JDE’s Julian format and when fiscal calendars don’t align with the calendar year. Building this capability correctly from the start prevents countless hours of troubleshooting later.
━━━━━━━━━━━━━━━━━━━━
Handling Multi-Currency and Unit of Measure Conversions
Global operations introduce additional complexity that affects JDE financial analysis accuracy:
- Your Canadian subsidiary records sales in CAD
- European operations use EUR
- The US parent company reports in USD
Without proper currency conversion logic, you can’t easily produce “total company sales in USD” comparing all regions.
The Currency Conversion Challenge:
The challenge extends beyond simple exchange rate multiplication. Different account types require different conversion methods:
- Balance sheet accounts: Typically use current rates
- Income statement accounts: Use average rates
- Equity accounts: Apply historical rates
If your analytics platform doesn’t implement this logic correctly, your consolidated financial statements won’t balance, and regulatory reporting becomes a nightmare.
Unit of Measure Complications:
Unit of measure conversions create similar problems for inventory and sales analysis. Products transact in multiple units: cases, individual items, and pallets. Without proper conversion factors, comparing products and analyzing inventory across locations becomes impossible.
━━━━━━━━━━━━━━━━━━━━
The Self-Assessment: Evaluating Your Current JDE Analytics Maturity
Before investing in improvements to your JDE financial analysis capabilities, take an honest look at your current state:
Quick Assessment Questions:
- Open your General Ledger Detail table in Power BI. Do you see readable dates like 1/1/2024, or do you see integers like 124001?
- Find five invoices in JDE and check whether the amounts match exactly in Power BI, or whether they’re off by a factor of ten or a hundred
- Try creating a simple year-over-year sales comparison. Does it work without manual manipulation?
- Can your finance team generate month-end reports without exporting data to Excel first?
- Do different departments trust each other’s numbers, or do reconciliation debates dominate your leadership meetings?
If these questions reveal problems, you’re experiencing what most JDE organizations encounter. The gap between what JDE captures and what your business needs for decision-making requires specialized expertise to bridge.
━━━━━━━━━━━━━━━━━━━━
Enterprise Architecture for Sustainable JDE Analytics
Organizations that achieve lasting success with JDE financial analysis invest in enterprise-grade architecture from the beginning. They recognize that what works with one year of data often fails with five years. They understand that performance degrades as user adoption increases and data volumes grow.
This perspective means choosing platforms that can scale with your business. A solution that works for basic departmental reporting may not support AI and machine learning workloads down the road. Integration with other systems, like CRM, equipment tracking, or safety platforms, requires a foundation designed for cross-functional analytics rather than siloed departmental views.
Real-World Lesson: The Washington Companies
The Washington Companies learned this lesson after two failed attempts with premier Microsoft partners to build custom JD Edwards analytics. Despite working with skilled technology consultants, the projects stalled because the partners didn’t understand the specific nuances of JDE.
“They didn’t understand E1…the knowledge of E1 is a big deal.”
— Steve Schmidt, BI Architect (18 years at the organization)
━━━━━━━━━━━━━━━━━━━━
Row-Level Security and Governance Considerations
As your JDE financial analysis capabilities mature, security becomes increasingly important. Different users need access to different data:
- A regional sales manager should see performance for their territory but not compensation details for other regions
- A controller at one business unit shouldn’t access financial details from sister companies
Security Implementation:
Implementing row-level security in Power BI requires careful design. You need to map JDE security structures to your analytics platform while maintaining performance as the user base grows. Organizations with hundreds or thousands of report users often discover that poorly designed security models create unacceptable query response times.
Governance Matters:
Data governance matters equally. Critical questions that need answers before your analytics platform goes into production:
- Who maintains the business logic?
- How do you handle changes when acquisition activities add new entities?
- What happens when your JD Edwards system gets upgraded?
━━━━━━━━━━━━━━━━━━━━
Moving from Departmental Reporting to Enterprise Analytics
Many organizations start their analytics journey with departmental solutions:
- Finance builds their own reports
- Operations creates separate dashboards
- Sales develops independent analyses
Each team solves immediate problems, but the approach creates long-term headaches for enterprise accounting analytics initiatives.
The Departmental Trap:
- Conflicting numbers emerge across Finance, Operations, and Sales
- Leadership meetings devolve into debates about whose calculations are correct
- Critical insights that require cross-functional data remain invisible because nobody owns the connections between systems
The Path Forward:
Consolidating these efforts into a unified platform with centralized business logic provides three key benefits:
- Single source of truth eliminates reconciliation debates
- Strategic cross-functional insights become possible
- Self-service analytics empowers users throughout the organization while maintaining consistent definitions and calculations
━━━━━━━━━━━━━━━━━━━━
Practical Steps Toward Improved JDE Financial Analysis
If you’re ready to improve your JDE financial analysis capabilities, start with a focused assessment:
→ Identify Your Highest-Value Use Cases
- Where do reporting delays hurt decision-making most?
- Which reconciliation activities consume the most staff time?
- What questions can’t your executives answer today because the data isn’t accessible?
→ Evaluate Your Technical Foundation
Ask yourself honestly:
- Do you have the internal expertise to handle Julian date conversion, decimal precision interpretation, and UDC translation across all necessary tables?
- Can your team build and maintain the hundreds of DAX measures required for enterprise financial reporting?
- Will your architecture scale as data volumes grow and user adoption increases?
For most organizations, the honest answer reveals significant gaps. Building this capability internally requires deep JDE expertise combined with advanced analytics skills, a combination that’s expensive to hire and difficult to retain.
Cost Reality: The Washington Companies discovered that what they paid for two failed custom build attempts exceeded the cost of a complete enterprise solution across all modules.
━━━━━━━━━━━━━━━━━━━━
The Value of Application Intelligence for JDE
Application Intelligence represents a different approach to solving JDE financial analysis challenges.
Rather than treating JD Edwards as a generic database, this methodology embeds deep system expertise directly into the analytics foundation.
Consider the Scale:
The QuickLaunch Application Pack for JD Edwards contains:
- Over 3,000 pre-defined measures
- More than 2,400 business-friendly dimensions
This represents decades of accumulated JDE expertise encoded into an analytics platform that works out of the box.
What This Means for Your Team:
- Julian dates convert automatically
- Decimal precision applies correctly across every field
- UDC codes translate to meaningful business terms
- Your finance team sees information they can use immediately, without waiting for IT to build custom solutions
Time-to-Value Difference:
- Custom builds: Typically require 12 to 24 months before delivering meaningful business value
- Application Intelligence solutions: Deploy in 8 to 12 weeks
Your organization starts making better decisions faster while spending less money and consuming fewer internal resources.
━━━━━━━━━━━━━━━━━━━━
Looking Ahead: AI Readiness and Advanced Analytics
The organizations achieving the best results from JDE financial analysis today are already positioning for advanced capabilities. Machine learning can optimize manufacturing settings, predict equipment failures, and identify patterns in customer behavior.
But these AI workloads require a data foundation with specific characteristics:
- Clean historical data
- Proper governance
- Complete documentation
- Structures optimized for analytical rather than transactional processing
Success Story: IGI Wax
IGI Wax provides a concrete example. Using machine learning on their QuickLaunch foundation, they optimized manufacturing settings to reduce waste from eight percent to four percent.
The Result: $8 to $10 million in increased annual profit.
This kind of outcome requires the right foundation, built correctly from the beginning.
Whether your immediate focus is improving month-end close times or your long-term vision includes AI-powered decision support, the path starts with solving the fundamental challenges of JDE financial analysis.
Transform Your JDE Financial Analysis with QuickLaunch Analytics
QuickLaunch Analytics has spent over 20 years helping organizations transform JDE financial analysis from a source of frustration into a competitive advantage. Our Application Intelligence platform embeds deep JD Edwards expertise directly into your analytics foundation, eliminating the translation problems that plague custom solutions.
With production-ready deployment in 8 to 12 weeks and proven results across 250+ organizations worldwide, we deliver the enterprise analytics capability your finance team needs without the years of effort and risk that custom builds require.
Ready to see what accurate, timely JDE financial analysis looks like for your organization?
Frequently Asked Questions
What Is JDE Financial Analysis?
JDE financial analysis is the practice of extracting, transforming, and interpreting financial data from JD Edwards enterprise systems to support business decision-making. Unlike standard reporting, which simply replicates transactional records, JDE financial analysis involves translating the system’s unique data structures, including Julian dates, decimal precision codes, and User Defined Codes, into meaningful business metrics. This process requires specialized expertise because JD Edwards stores information in ways that generic business intelligence tools cannot interpret correctly. When implemented properly, JDE financial analysis transforms raw transactional data into consolidated financial statements, performance dashboards, and strategic insights that executives can act upon with confidence.
How Does JDE Financial Analysis Improve Reporting Accuracy?
JDE financial analysis improves reporting accuracy by addressing the root causes of data discrepancies rather than just the symptoms. The improvement starts with proper data transformation: Julian dates convert to standard calendar formats, decimal precision codes apply correctly to every numeric field, and User Defined Codes translate to meaningful business descriptions. This eliminates the common problem where an invoice of $1,234.56 displays as $123,456.00 due to misinterpreted decimal placement. Beyond data transformation, JDE financial analysis standardizes business logic across the organization so that Finance, Operations, and Sales all calculate metrics like gross margin using identical formulas. This consistency eliminates the “whose numbers are right” debates that plague organizations relying on departmental spreadsheets and manual reconciliation processes.
What Challenges Exist in JDE Financial Reporting?
What challenges exist in JDE financial reporting typically fall into three categories: data structure complexity, business logic fragmentation, and scalability limitations. The data structure challenges stem from JD Edwards storing dates as Julian integers, using cryptic table and field names like F0901 and GBMCU, applying decimal precision codes that require interpretation, and relying on thousands of User Defined Codes for business context. Business logic fragmentation occurs when different departments create their own calculations without centralized governance, leading to conflicting metrics and eroded trust in analytics. Scalability limitations emerge when solutions built for basic reporting cannot handle growing data volumes, increased user adoption, or advanced requirements like AI and machine learning workloads. Organizations that attempt custom solutions without deep JDE expertise typically encounter extended timelines, budget overruns, and analytics platforms that users ultimately reject.