Your JD Edwards system holds years of transaction history, order patterns, and customer interactions. Yet most organizations still treat every customer the same.
JD Edwards RFM analysis changes that dynamic by transforming raw sales data into actionable customer intelligence, helping you separate your champions from your casual buyers and everyone in between.
What is RFM?
RFM stands for Recency, Frequency, and Monetary value. These three behavioral metrics, when combined, reveal which customers deserve your attention and resources.
Recency frequency monetary analytics has been around for decades in direct marketing, but applying it effectively to JD Edwards data requires overcoming the platform’s inherent analytics challenges. Done right, though, the payoff is substantial: smarter marketing spend, improved retention efforts, and sales teams focused on the relationships that actually move the needle.
Here are seven practical ways JD Edwards RFM analysis delivers real business value.
━━━━━━━━━━━━━━━━━━━━
1. Surface Your Most Profitable Customer Relationships
Every business has customers who consistently order, pay on time, and generate healthy margins. The problem? They often get the same treatment as one-time buyers who disappeared years ago.
Without structured ERP customer segmentation, your sales team allocates effort based on gut instinct or squeaky-wheel dynamics rather than actual profitability.
How RFM Analysis Cuts Through the Noise:
By scoring customers on three key metrics, you can quickly identify your top-tier accounts:
- Recency: How recently they purchased
- Frequency: How often they buy
- Monetary value: How much they spend
These are the relationships worth protecting with dedicated account management, priority service levels, and proactive outreach before competitors come knocking.
The Insight Goes Beyond Simple Revenue Rankings:
A customer who spent heavily three years ago but hasn’t ordered since scores very differently than one with consistent monthly purchases. JD Edwards RFM analysis captures these behavioral nuances, revealing the full picture of customer value over time.
━━━━━━━━━━━━━━━━━━━━
2. Catch Customer Churn Before It Happens
Recency is the earliest warning indicator you have.
When a previously active customer goes quiet, something has changed. Maybe they found a competitor, maybe their needs evolved, or maybe a service issue drove them away. Whatever the reason, the window for intervention closes quickly.
The Early Warning System:
JD Edwards stores the transaction dates you need to monitor recency across your entire customer base. With proper analytics, you can flag accounts showing declining activity before they fully disengage.
- Sales teams get prioritized lists of at-risk customers to contact
- Complete with historical context about what they used to buy and how often
- Proactive approach to retention costs far less than acquiring replacement customers
The Cost of Waiting:
This proactive approach to retention costs far less than acquiring replacement customers. JD Edwards RFM analysis makes the early warning signals visible, turning reactive firefighting into strategic relationship management.
━━━━━━━━━━━━━━━━━━━━
3. Guide Smarter Marketing and Sales Investment
Marketing budgets face constant pressure to prove ROI. Blasting the same campaigns to your entire customer list wastes resources on accounts that were never going to respond while under-investing in segments primed for growth.
Precision Targeting Through RFM Scoring:
Customer segmentation through RFM scoring enables data-driven allocation based on demonstrated customer behavior:
High-Scoring Customers
Receive exclusive early access to new products or loyalty rewards
Mid-Tier Customers with Growth Potential
Get nurturing campaigns designed to increase purchase frequency
Dormant Accounts
Receive win-back offers with different messaging than active buyers
JD Edwards contains the purchase history needed to build these segments. The challenge lies in extracting and analyzing that data efficiently, a task that native JD Edwards reporting handles poorly. When you solve the analytics gap, though, marketing shifts from guesswork to data-driven allocation based on demonstrated customer behavior.
━━━━━━━━━━━━━━━━━━━━
4. Improve Sales Territory and Account Assignments
Sales territory design often reflects history and politics more than strategic logic. Reps inherit account portfolios without clear visibility into which customers actually warrant intensive coverage versus transactional support.
Objective Criteria for Account Prioritization:
JD Edwards RFM analysis provides objective criteria that reduces debates and aligns resources:
- High-RFM-score accounts justify dedicated relationship management
- Lower-scoring accounts might shift to inside sales or digital self-service channels
- Field reps can focus where personal attention generates returns
The Result: This data-driven approach to territory management reduces the debates about who owns what. More importantly, it aligns sales capacity with customer potential. RFM modeling in ERP systems like JD Edwards gives you objective metrics defining “best” beyond simple revenue.
━━━━━━━━━━━━━━━━━━━━
5. Identify Upsell and Cross-Sell Opportunities
Customers with high frequency and monetary scores but room to grow represent prime expansion opportunities. They already trust your organization and buy regularly. The question is whether they’re purchasing everything they could from you.
Finding the Growth Gaps:
Combining JD Edwards RFM analysis with product data reveals these opportunities:
Maybe a customer orders electrical supplies monthly but sources plumbing products elsewhere. Maybe they buy in certain categories but haven’t tried higher-margin alternatives.
The frequency and recency components confirm engagement while the monetary analysis highlights expansion potential.
Strategic Sales Conversations:
Sales teams armed with this intelligence can approach conversations strategically rather than generically. “I noticed you order X regularly but haven’t tried Y, which several similar customers find useful” lands differently than unfocused pitches about whatever product is on promotion this month.
━━━━━━━━━━━━━━━━━━━━
6. Validate and Refine Customer Classification Systems
Many organizations maintain customer tiers, classifications, or segments that originated years ago and haven’t been validated since.
- The “strategic account” that qualified based on a big project five years ago may have become essentially inactive
- A mid-tier classification might mask accounts that have grown substantially
The Behavioral Reality Check:
RFM scoring provides a behavioral reality check against static classifications. When your stated VIP customers consistently score lower than accounts classified as standard, something needs adjustment. Either the classification criteria are wrong, or the relationship has shifted and nobody updated the status.
Making Disconnects Visible:
JD Edwards RFM analysis makes these disconnects visible. The conversation shifts from defending historical classifications to examining current behavior, which is a much more productive basis for how your organization allocates attention and resources.
━━━━━━━━━━━━━━━━━━━━
7. Build Foundation for Predictive Customer Analytics
RFM analysis represents a stepping stone toward more advanced JD Edwards customer insights. The same behavioral patterns that identify current high-value customers can train predictive models to forecast future value, anticipate churn probability, or optimize lifetime value calculations.
The Data Foundation for AI:
JD Edwards contains years of historical transaction data, exactly what machine learning models need to identify patterns and generate predictions. But those models require clean, structured inputs.
Building your JD Edwards RFM analysis capability creates the data foundation for AI and predictive analytics down the road.
Organizations that skip this foundation work find their AI initiatives stalled by data quality issues. Starting with RFM delivers immediate value while preparing your analytics infrastructure for more sophisticated use cases as your capabilities mature.
━━━━━━━━━━━━━━━━━━━━
The Challenge: Making JD Edwards Data Analytics-Ready
These seven applications share a common prerequisite: getting JD Edwards data into an analytics-ready format. And that’s where most organizations struggle.
Why JDE Makes RFM Analysis Difficult:
JD Edwards was architected for transactions, not analytics.
- Customer data sits across multiple tables with cryptic names like F0301, F03012, and F4211
- Transaction dates are stored as Julian integers
- The relationships between sales orders, invoices, shipments, and payments require understanding complex joins across hundreds of interconnected tables
The Manual Workaround Problem:
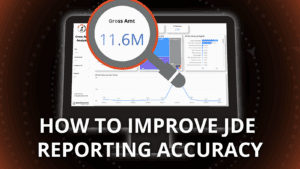
Native JD Edwards reporting can produce basic lists and summaries. It cannot easily calculate the RFM scores, segment customers dynamically, or visualize behavioral patterns over time.
Finance and sales teams end up exporting data to Excel, manually building customer analyses that are outdated before they’re finished.
The Custom Build Trap:
IT teams attempting to build custom Power BI solutions face months of development work translating JD Edwards cryptic schemas into usable analytics models. Even then, they’re starting from scratch without the pre-built business logic for customer analytics that mature solutions provide.
━━━━━━━━━━━━━━━━━━━━
How Application Intelligence Accelerates Time-to-Value
QuickLaunch Analytics’ JD Edwards Application Pack solves these challenges with a purpose-built analytics foundation.
Instead of months of custom development, organizations get production-ready JD Edwards analytics in weeks.
Automatic JDE Complexity Handling:
The platform automatically handles the JD Edwards-specific complexities:
- Julian date conversions
- Decimal precision codes
- User-defined code translations
- Intricate table relationships that trip up generic BI tools
Unified Customer Data:
Customer data is unified across modules with conformed dimensions that work consistently whether analyzing sales, accounts receivable, or service history.
Pre-Built Business Perspectives:
Pre-built business perspectives provide the building blocks for RFM analysis without requiring data modeling expertise:
- The same data foundation supports Power BI dashboards
- Enables self-service reporting
- Integrates with CRM systems
- Sales and marketing teams get the customer intelligence they need in the tools they already use
Transform JDE from Archive to Competitive Advantage
For organizations ready to move beyond basic reporting toward data-driven customer management, Application Intelligence transforms JD Edwards from a transactional archive into a source of genuine competitive advantage.
Ready to Unlock the Customer Intelligence Hidden in Your JD Edwards Data?
QuickLaunch Analytics helps enterprises transform ERP data into actionable insights, including the RFM analysis capabilities covered here.
Our JD Edwards Application Pack delivers production-ready analytics in weeks, not months, with pre-built customer intelligence perspectives that sales and marketing teams can use immediately.
See how JD Edwards Application Intelligence can accelerate your analytics journey.
Frequently Asked Questions About JD Edwards RFM Analysis
What is JD Edwards RFM analysis?
JD Edwards RFM analysis is a customer segmentation method that scores customers based on three behavioral factors using data stored in your JDE system: Recency (how recently they purchased), Frequency (how often they buy), and Monetary value (how much they spend). This approach transforms years of transaction history in JD Edwards into actionable customer intelligence, helping organizations identify their most valuable accounts, spot churn risks early, and allocate sales and marketing resources more effectively.
How does RFM modeling help customer segmentation?
RFM modeling helps customer segmentation by combining multiple behavioral dimensions into meaningful groups rather than relying on simple revenue rankings or static classifications. The modeling process scores each customer across all three factors, then groups them into segments like “champions” (high scores across the board), “at-risk” (formerly active but declining recency), or “growth potential” (high frequency but lower monetary value). This behavioral approach to segmentation reveals patterns that single-metric reports miss entirely, enabling targeted strategies for each customer group.
Why do companies use JD Edwards RFM analysis?
Companies use JD Edwards RFM analysis because it turns existing transaction data into strategic customer intelligence without requiring new data collection. The primary reasons include:
- Identifying which customers deserve priority attention and resources
- Catching declining engagement before customers fully churn
- Guiding marketing spend toward segments most likely to respond
- Validating whether current customer classifications reflect actual behavior
- Building a foundation for more advanced predictive analytics
Since JD Edwards already contains years of detailed purchase history, RFM analysis unlocks value from data the organization has already invested in collecting.
Can small and mid-sized companies benefit from customer segmentation?
Small and mid-sized companies benefit significantly from customer segmentation through JD Edwards RFM analysis. In many ways, the impact is more pronounced than at large enterprises because resources are more constrained. When a smaller sales team can focus on genuinely high-potential accounts rather than spreading effort evenly across all customers, the productivity gains compound quickly. The approach scales to any organization with sufficient transaction history to analyze.
How long does it take to implement JD Edwards RFM analysis capabilities?
Implementation time for JD Edwards RFM analysis capabilities depends entirely on the approach:
- Custom development projects: Typically require months to build the data extraction, transformation, and visualization layers needed for customer analytics
- Pre-built solutions like QuickLaunch Analytics: Organizations can achieve production-ready analytics infrastructure in weeks rather than months
This delivers immediate value while establishing the foundation for more advanced customer intelligence over time.
Does JD Edwards RFM analysis work with Power BI?
JD Edwards RFM analysis works excellently with Power BI once the underlying data is properly prepared. Power BI provides interactive visualization, self-service exploration, and sharing capabilities that make RFM insights accessible to sales and marketing teams. The challenge lies in getting JD Edwards data into Power BI in analytics-ready format, which requires handling the date conversions, code translations, and table relationships that JDE requires. Application Intelligence solutions solve this challenge by delivering clean data models optimized for Power BI consumption.
What’s the relationship between RFM analysis and customer lifetime value?
The relationship between RFM analysis and customer lifetime value (CLV) is complementary but distinct. RFM analysis segments customers based on observed behavior to date, while CLV attempts to predict future value over the entire customer relationship. RFM scoring often serves as a foundation for CLV modeling because the behavioral patterns captured in RFM calculations feed predictive models that forecast which customers will generate the most value going forward. Organizations typically master RFM analysis before advancing to more complex CLV calculations.