Thanksgiving Visualized: The Holiday in Maps, Charts and Graphics

By QuickLaunch Analytics  |  November 26, 2019

We are always grateful, and especially at Thanksgiving, for the brilliant customers, innovative partners, engaged community, and dedicated employees that make QuickLaunch Analytics possible. May you indulge in some well-earned time off, however you decide to spend it.

Once again we’ve curated some fun Thanksgiving-related articles and visualizations for your post-turkey reading. Enjoy!


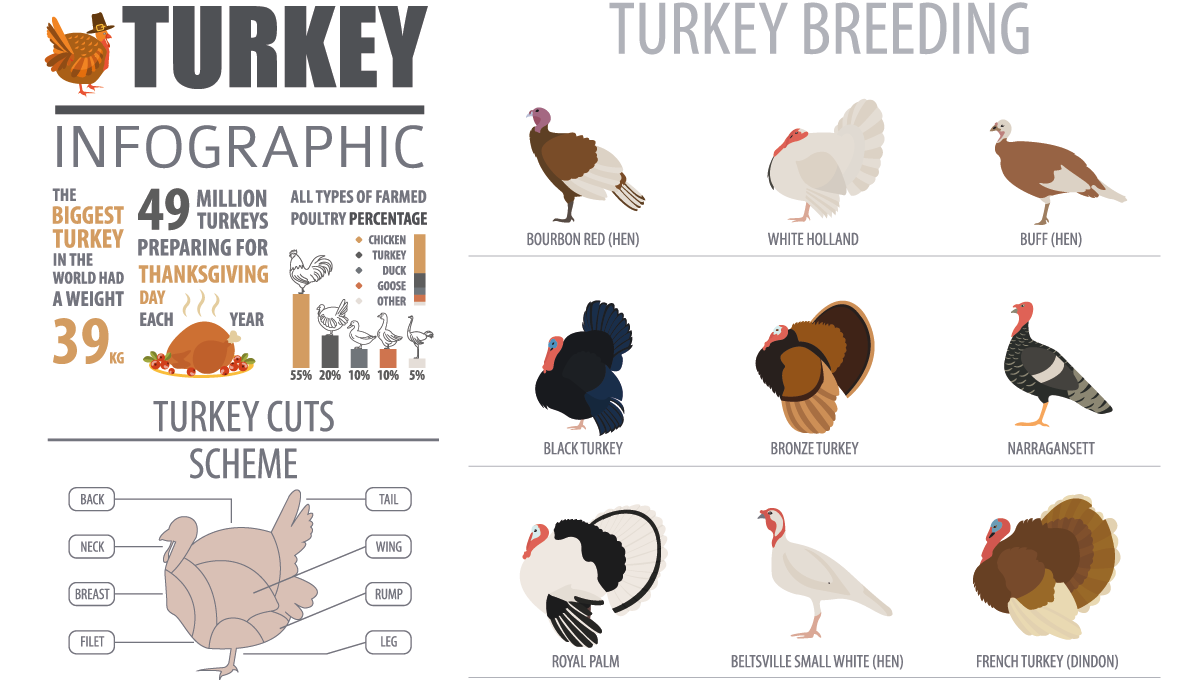
1. Let’s Talk Turkey

Whether you prefer leg, breast, or rump, Bourbon Red or White Holland, you’d better know what you’re eating. 


2. Turkey Day Exposé: How Americans Really Feel About the Big Dinner

Fill up on this feast of facts.

Source: The Harris Poll for Instacart


3. Mapping Thanksgiving

A round-up of data, charts, and graphs to make your holiday weekend logistics a breeze.

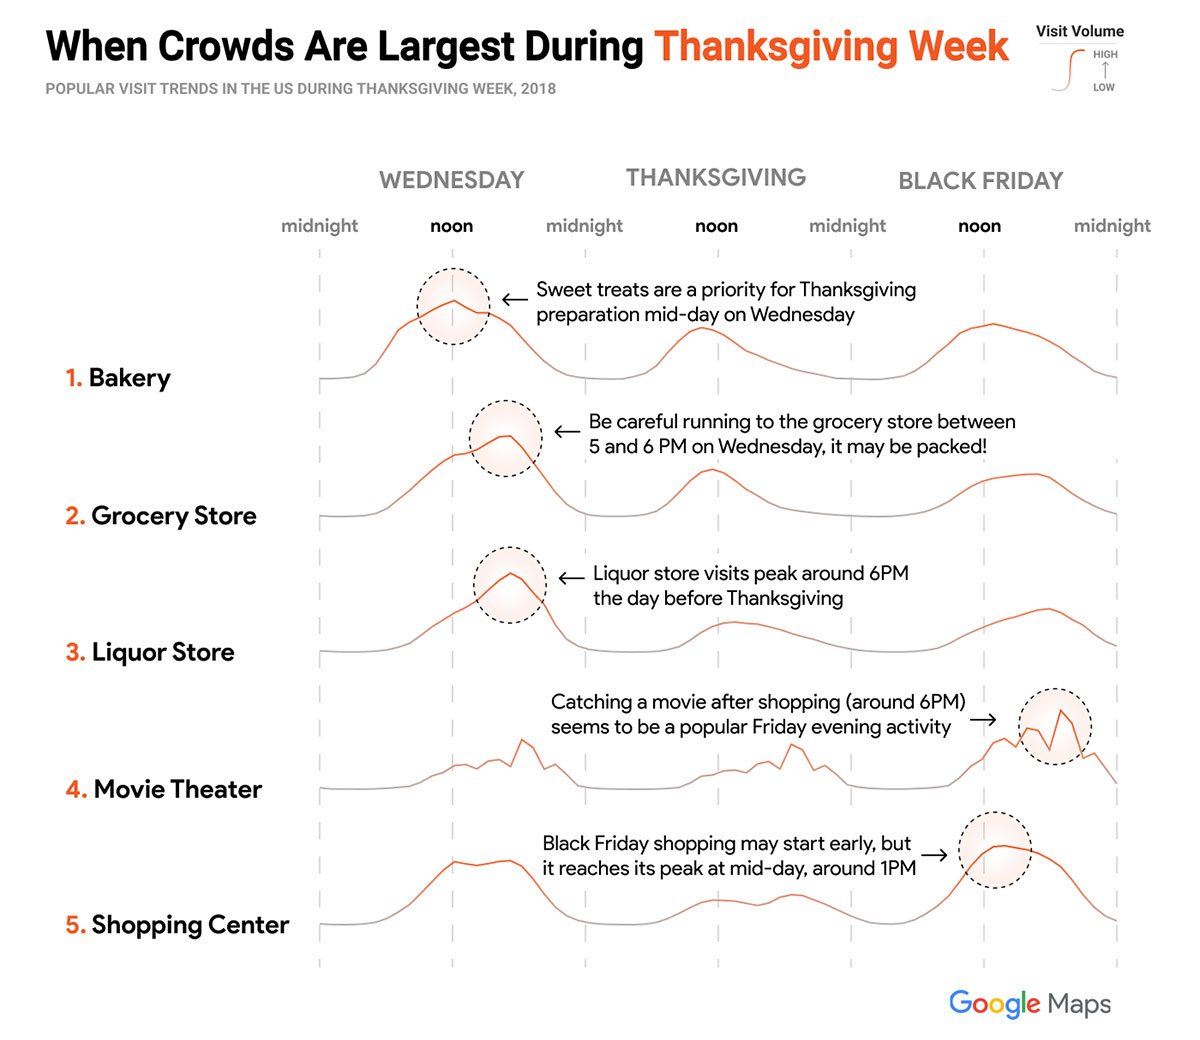
Source: Google Maps and Google News Lab


4. Seven Charts That Will Save You All The Stress On Thanksgiving

All the food, none of the fails.
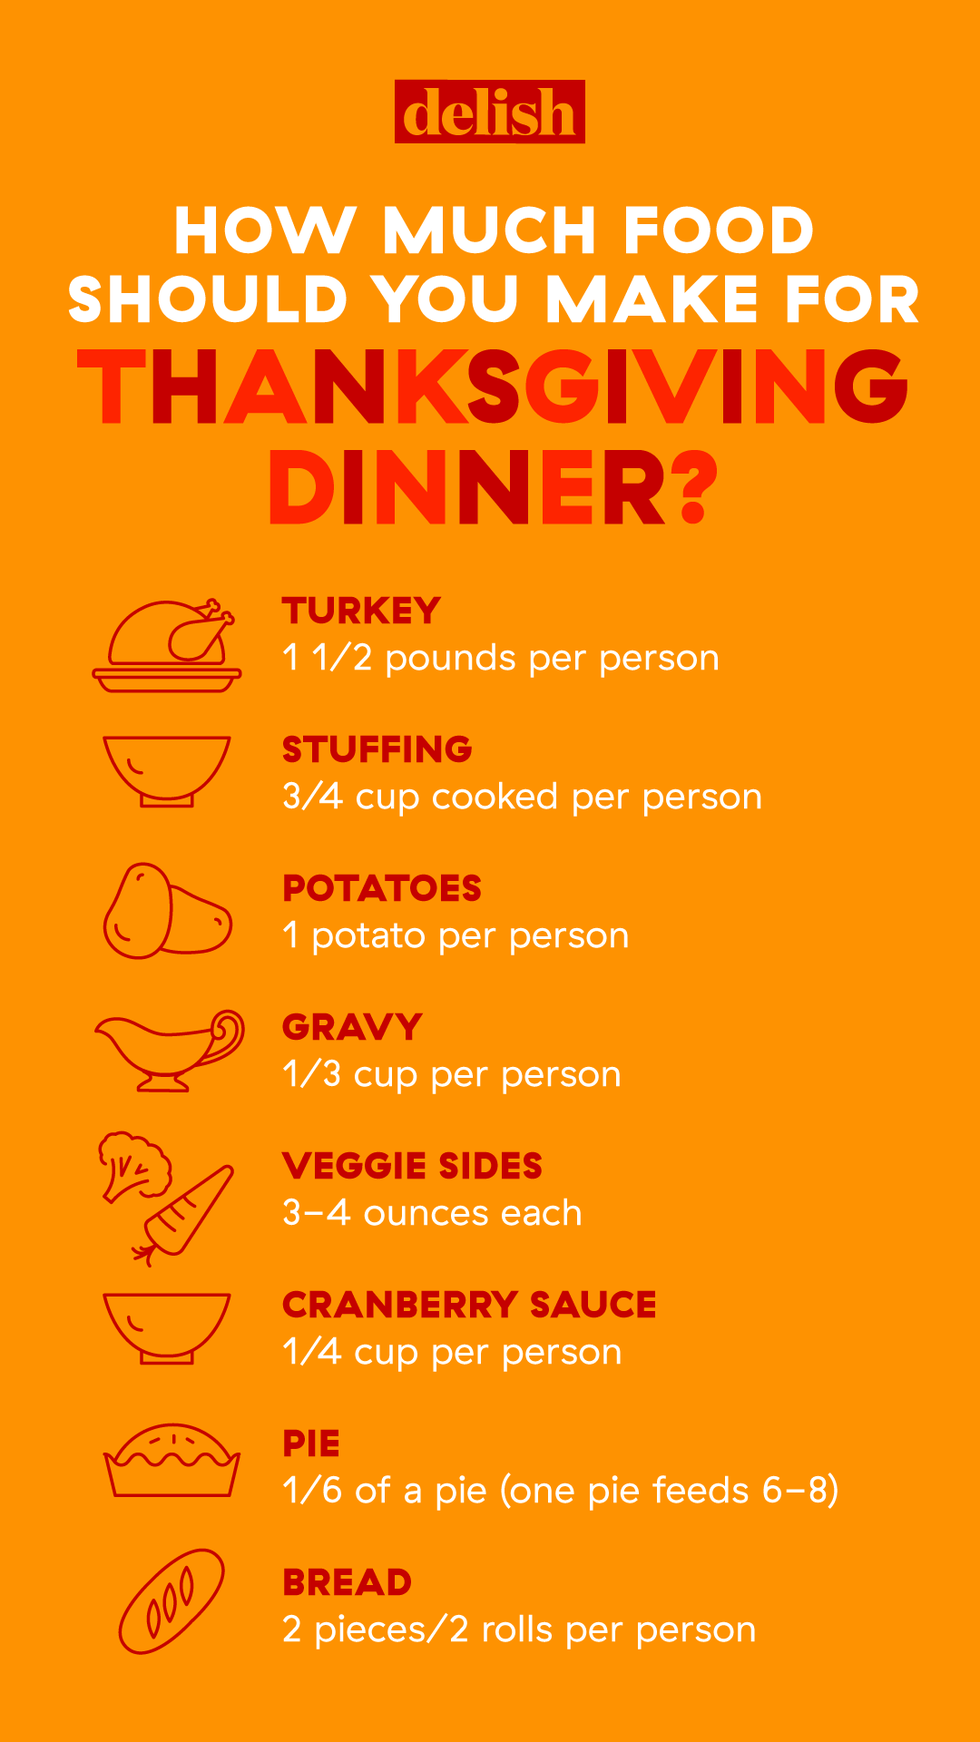
Source: Delish


5. Thanksgiving Weather Forecast

Thanksgiving travel could be disrupted by rain and snow across the U.S. Here’s what to know.

Source: Time


6. Thanksgiving and the NFL

Learn how the football-on-Thanksgiving tradition began.

Source: Pro Football Hall of Fame


7. By the Numbers: 2019 Thanksgiving Travel Forecast

More than 55 million travelers are taking to the roads and skies this Thanksgiving.

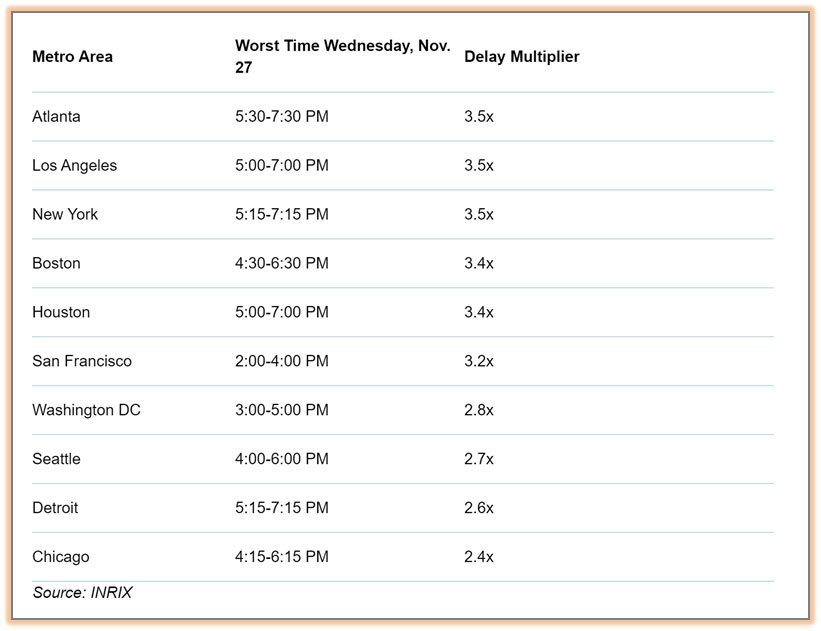
Source: AAA and INRIX


8. The Ultimate Thanksgiving Drinking Game

Silly good fun whether you imbibe or not!

Source: BuzzFeed


9. GivingTuesday Is December 3

Join the global generosity movement.

Source: GivingTuesday

Quicklaunch Analytics - Enterprise Analytics Platform

About the Author

Preferred Strategies

QuickLaunch Analytics is helping hundreds of JD Edwards and Viewpoint Vista customers to realize the full potential of their ERP data through the innovative QuickLaunch Analytics QuickLaunch product.

Related Articles

Supply and Demand Analytics
December 03, 2025
How JDE Supply and Demand Analytics Improve Forecasting and Production Planning

Manufacturing and distribution companies running JD Edwards face a persistent challenge: their ERP captures every purchase order, production run, and inventory movement, yet extracting actionable insights for forecasting and production planning remains frustratingly difficult. JDE supply and demand analytics can transform this situation, but only when organizations move beyond basic reporting to embrace a unified approach that connects operational data with business intelligence. When implemented correctly, manufacturing ERP analytics become the foundation for smarter decisions across the entire supply chain.   The disconnect between what JD Edwards captures and what operations teams can actually see creates real problems: Your purchasing

Read More >
November 11, 2025
Ultimate Guide to Connecting NetSuite to Power BI

The Ultimate Guide to Connecting NetSuite to Power BI If you’re reading this, you probably already know your NetSuite system holds valuable business data. But getting that data into Power BI in a way that’s actually usable? That’s where most organizations struggle. This isn’t just about connecting to a database. NetSuite’s cloud-native architecture was built for flexibility and customization, not necessarily for straightforward analytics. Multi-subsidiary structures, custom fields and segments, transaction tables storing dozens of transaction types, and multi-currency operations create complexity that goes far beyond standard database integration. These aren’t minor inconveniences; they’re fundamental architectural differences that determine whether

Read More >
Connect Viewpoint Vista to Power BI
November 07, 2025
Ultimate Guide to Connecting Vista to Power BI

The Ultimate Guide to Connecting Viewpoint Vista to Power BI If you’re reading this, you probably already know your Viewpoint Vista system holds valuable construction data. But getting that data into Power BI in a way that’s actually usable? That’s where most construction firms struggle. This isn’t just about connecting to a database. Vista was built for construction project management and accounting, not analytics. Complex cost structures spanning Job Cost (JC), Project Management (PM), Accounts Payable (AP), Payroll (PR), and Service Management (SM) modules. Multi-calendar complexity for fiscal versus project schedules. Custom User Defined (UD) fields unique to each implementation.

Read More >