IT Below you will find all IT Content Data Analytics 7 Ways Enterprise Power BI Data Models Unlock Cross-Functional Insights Beyond Departmental Reporting Read More Data Analytics Decoding the Data Lakehouse: The Blueprint for Smarter, Faster Decisions Read More Company Unveiling QuickLaunch Analytics: Transforming Data into Knowledge Read More Data Analytics Maximize Efficiency with Supply and Demand Planning Analytics for JD Edwards Read More Uncategorized QuickLaunch for Vista Release Notes: Payroll Detail, Equipment Maintenance, Warranty Details and Much More! Read More Data Analytics Power BI Updates for Enterprise Analytics: Q2 2023 – Part 1 Read More Company QuickLaunch Analytics Invites JD Edwards Users to Take a QuickLaunch Test Drive Read More Company QuickLaunch Analytics Celebrates 20th Anniversary by Closing 2021 with Record Increases in Customer Base and… Read More Company iShift and QuickLaunch Analytics Partner to Enable Businesses to Make the Most of Their Enterprise… Read More Data Analytics Power BI Updates for QuickLaunch Customers: Q3 2021 Read More
Data Analytics 7 Ways Enterprise Power BI Data Models Unlock Cross-Functional Insights Beyond Departmental Reporting Read More
Data Analytics Maximize Efficiency with Supply and Demand Planning Analytics for JD Edwards Read More
Uncategorized QuickLaunch for Vista Release Notes: Payroll Detail, Equipment Maintenance, Warranty Details and Much More! Read More
Company QuickLaunch Analytics Celebrates 20th Anniversary by Closing 2021 with Record Increases in Customer Base and… Read More
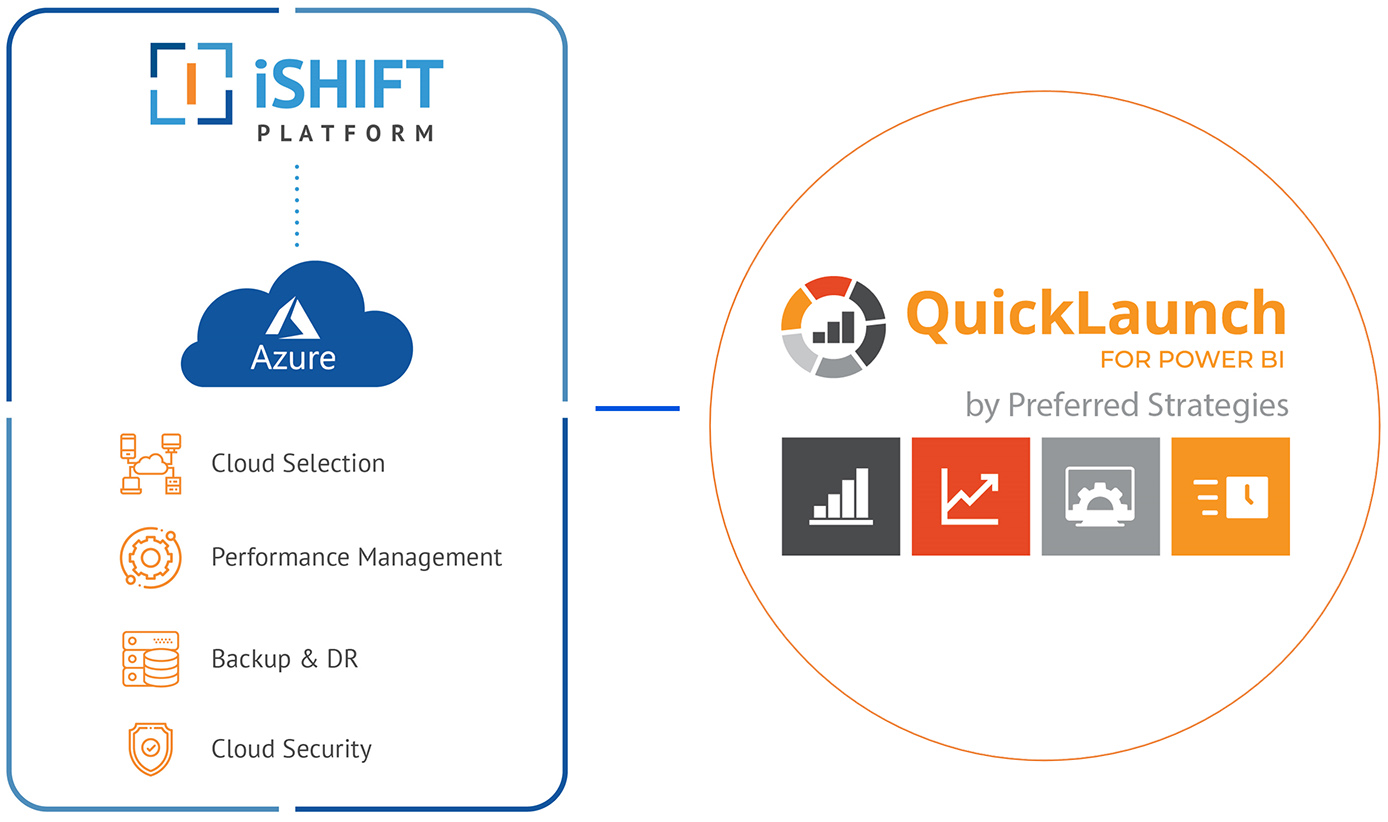
Company iShift and QuickLaunch Analytics Partner to Enable Businesses to Make the Most of Their Enterprise… Read More