Author: David Kettinger
Power BI Updates for QuickLaunch Customers: Q1 2021
Power BI was named a leader in the Gartner magic quadrant again this year. (Be sure to check out our interactive analysis of the Magic quadrant here.) A major factor of Power BI’s success has been the dedication by Microsoft to continuously improve the Power BI product suite with updates that are demand-driven and consistent.
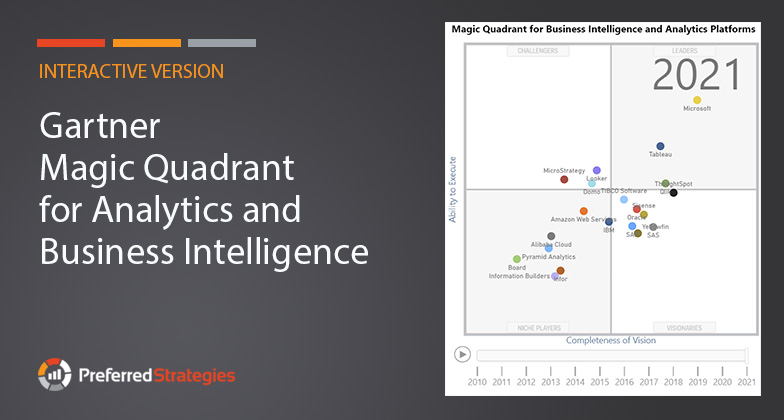
Interactive Gartner Magic Quadrant for Analytics Trend Analysis
In this article we showcase an interactive version of the Gartner Magic Quadrant for Analytics and Business Intelligence (ABI) built using Microsoft’s Power BI platform. Using this interactive view of the data, you can see how vendors have trended over the past 11 years.
Power BI Updates for QuickLaunch Customers: 2020 in Review – Part 3 – Admins & Content Managers
In the third part of our 2020 in Review series, we cover new features and enhancements to the product designed to help users who are responsible for administering the usage, deployment, and adoption of Power BI within their organizations.
Power BI Updates for QuickLaunch Customers: 2020 in Review – Part 2 – Designers
Designing reports and dashboards in Power BI is exciting because things are constantly being upgraded to make your life easier and more interesting. The Power BI team releases updates for Power BI Desktop on a monthly cadence. In the second part of our 2020 in Review series, we will review some of our favorite updates for Power BI users that are responsible for creating reports and dashboards.
Power BI Updates for QuickLaunch Customers: 2020 in Review – Part 1 – Consumers
The Power BI team constantly rolls out new features and enhancements to the Power BI platform including updates to the Power BI Desktop, the Power BI Service, and the Power BI Mobile App. While it is awesome that Microsoft is committed to this continuous delivery strategy to quickly push updates into production, sometimes it can feel like drinking out of a firehose when trying to keep up with all the latest news.

2020 Will See Modern BI & Self-Service Analytics Central to Digital Transformation Initiatives
If “Digital Transformation” was the watchword in 2019, it will be the driving force in 2020—and beyond. This year organizations continued to adopt policies and technologies in efforts to become increasingly data-driven and establish a “data culture” within their companies.

Let’s Meet at JD Edwards INFOCUS 2019!
INFOCUS is just a month away. We look forward to three great days of networking, learning, and fun! Let’s connect in Denver: Visit us in Booth #322 Come by for your personal QuickLaunch™ demo! We can’t wait to show you how QuickLaunch makes it fast and easy to implement self-service JD Edwards reporting and analytics with Microsoft® Power BI and other modern BI tools.

How to Build JDE Dashboards in Minutes – and Get Noticed! Webinar Q&A
We co-hosted a webinar with GSI which had an outstanding attendance. There were many excellent questions and we were not able to provide answers to all of them during the webinar. Below is the Q&A transcript.
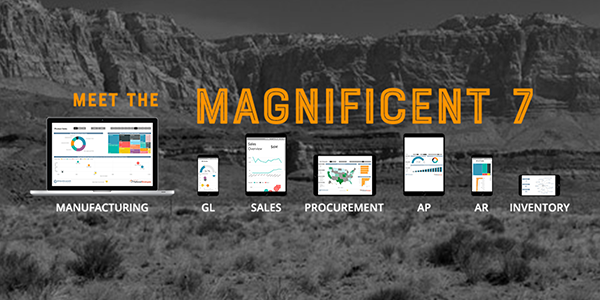
Meet the Magnificent Seven
According to Gartner Research, by 2020 self-service data preparation tools will be used in more than 50% of all new data integration efforts for analytics. In the same time frame, 85% of new BI platform spending by large and midsize organizations globally will be on modern BI platforms such as a sharepoint dashboard to display concise but detailed and relevant data on any business interaction, process or sales, etc.

Brasfield & Gorrie Brings Data Innovation to Construction
Founded in 1964, Brasfield & Gorrie is one of the nation’s largest privately held construction firms, providing general contracting, design-build, and construction management services for a wide variety of markets. Skilled in construction best practices, including virtual design and construction, integrated project delivery, and lean construction, Brasfield & Gorrie is best known for its preconstruction and self-perform expertise and exceptional client service.