According to Gartner Research, by 2020 self-service data preparation tools will be used in more than 50% of all new data integration efforts for analytics. In the same time frame, 85% of new BI platform spending by large and midsize organizations globally will be on modern BI platforms such as a sharepoint dashboard to display concise but detailed and relevant data on any business interaction, process or sales, etc. Any way you look at it, the trend is here to stay: the ability for business users to access data across the enterprise and then cleanse, enrich, join, normalize, and format the data for visualization on a BI tool is now an essential part of day-to-day business operations in any department.
Another important trend is the clear emergence of self-service BI tools such as Microsoft® Power BI- which recently took the top spot in Gartner’s Self-Service BI Magic Quadrant-Tableau, and Qlik as mainstream productivity tools for business professionals. From KPI dashboards to function-specific analytics and reporting, to advanced data science and predictive modeling, advanced visualization tools are used daily to understand and derive value from an ever-growing volume of data.
These trends are especially applicable to JD Edwards users who, until now, have been reliant on IT resources and programmers to derive insights from the data. JD Edwards offers various modules that cover a wide range of business functions across the company. From finance and accounting to HR and sales, the JDE modules are designed to provide critical back office infrastructure for day-to-day operations.
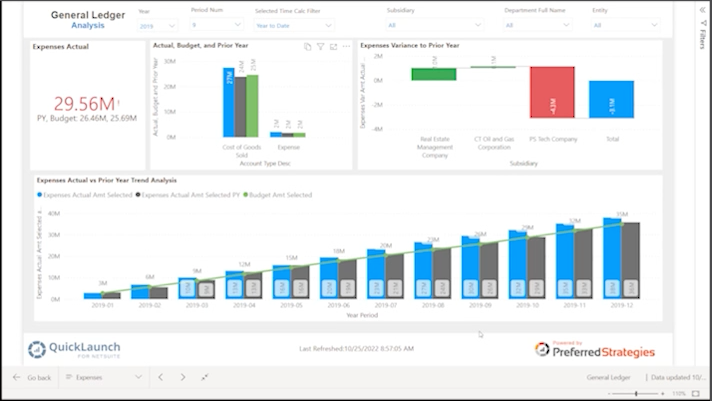
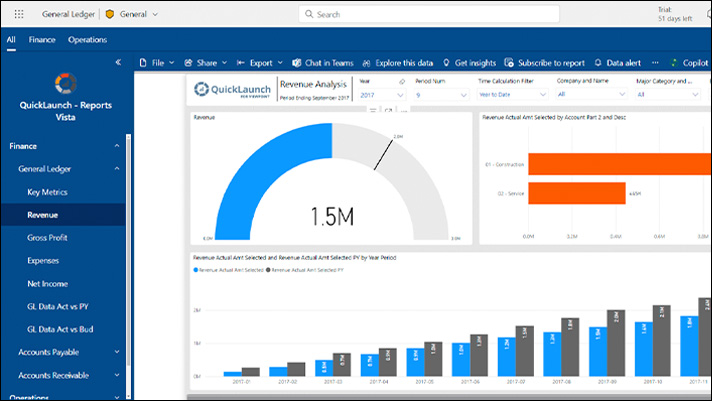
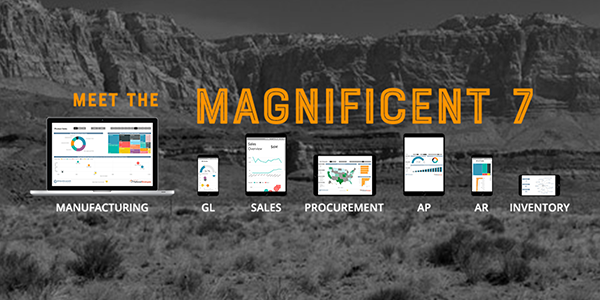
QuickLaunch Analytics QuickLaunch™ for Microsoft Power BI delivers complementary dashboard visualizations for each of the JDE modules. Like all things, some modules are used more widely than others so we want to take this opportunity to introduce you to each of the Magnificent Seven.
Finance & Accounting
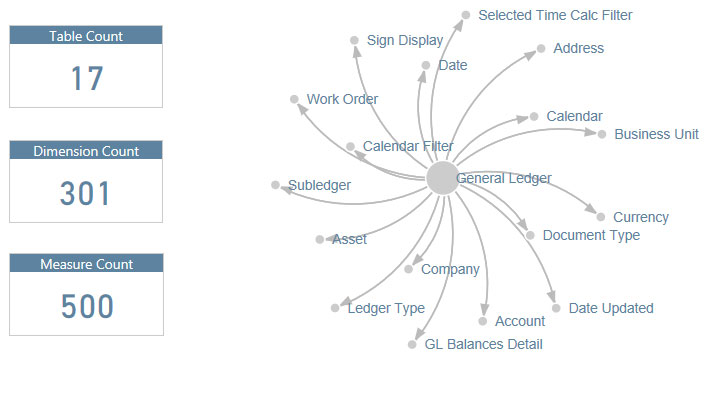
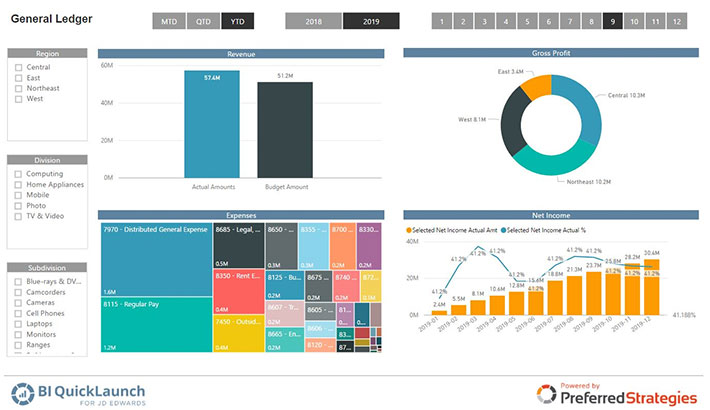 General Ledger |
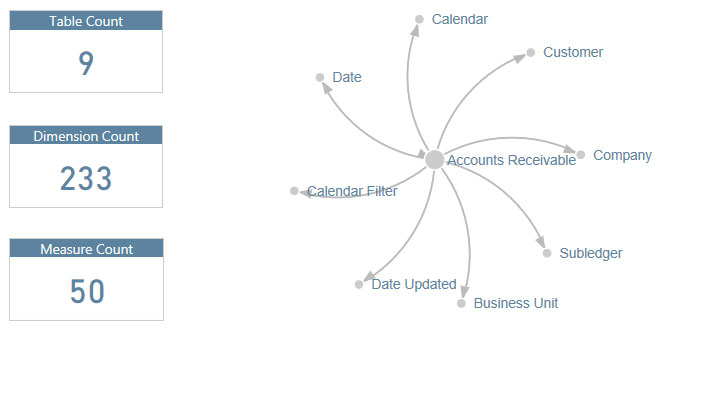 Accounts Receivable |
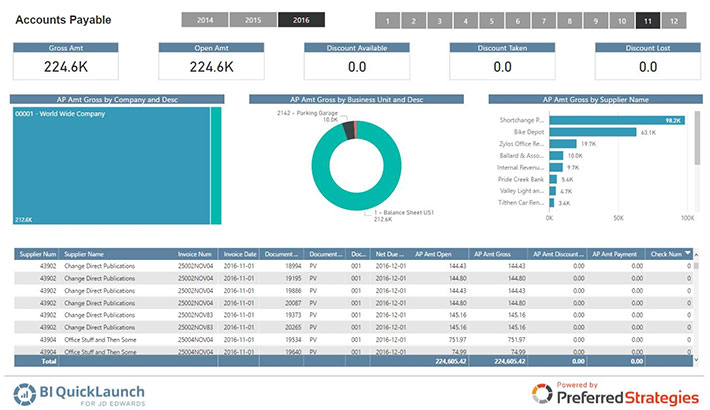 Accounts Payable |
Distribution
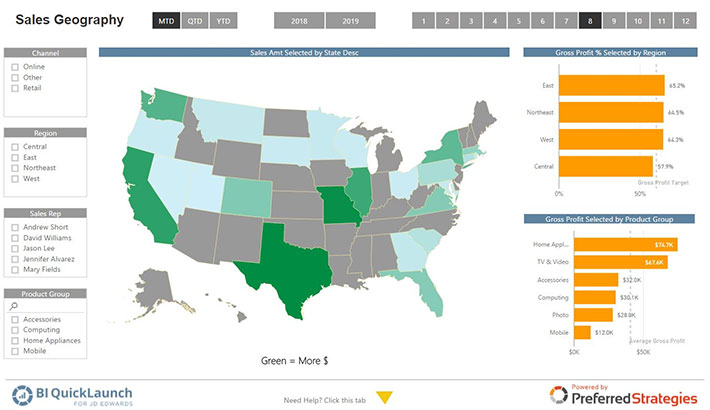 Sales |
 Inventory |
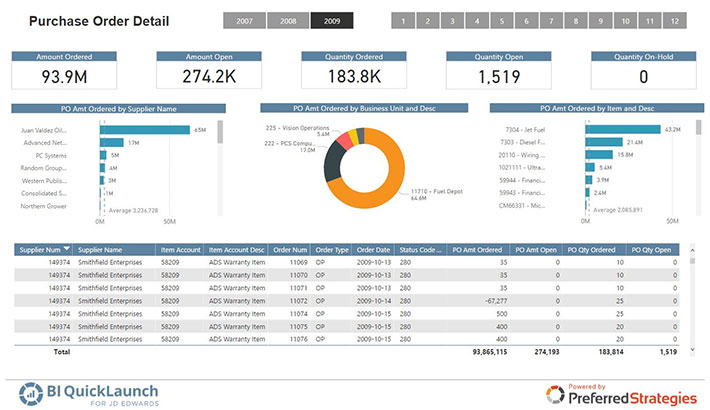 Procurement |
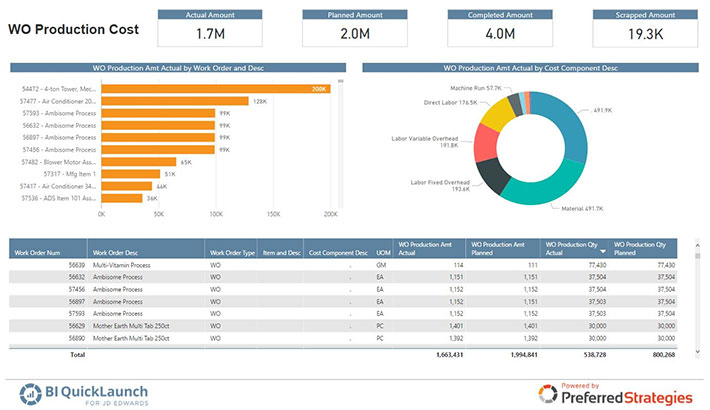
Manufacturing
 |
With QuickLaunch Analytics you will be up and running in hours, and self-sufficient with reporting and analytics. As Jeff Cook, CFO at Mann Packing, a grower/distributor in California said, “This is nirvana! We accomplished more with QuickLaunch and Power BI in hours than we have with other systems in years.”
Find out how QuickLaunch Analytics can transform your reporting and analytics with the Magnificent Seven. Contact us today for a demo or try it FREE for yourself. Don’t let your growing volume of data turn your business in to the Wild West!