- Posted record breaking increases in year-over-year customer base and revenue growth
- Reported 37 percent staff growth with more positions to fill in 2022
- Expanded QuickLaunch product line for Salesforce and NetSuite users
- Launched redesigned website showcasing unique features and benefits, updated QuickLaunch solutions, and extensive educational content.
- Announced an Employee Stock Ownership Plan (ESOP) as the first step towards its transition to becoming an employee-owned company
- Closed the year with a customer Net Promoter Score® of 74
- Earned an employee Net Promoter Score® (eNPS) of 92
About QuickLaunch Analytics
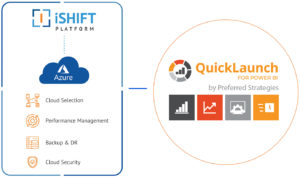
QuickLaunch Analytics was founded in 2002 by experienced JD Edwards business users and IT professionals. While working at a large construction materials and contracting company, QuickLaunch Analytics’ Founder & President, Adam Crigger, experienced firsthand the difficulty in extracting data from JD Edwards and translating that data into meaningful reports and analytics. Today, QuickLaunch Analytics is helping hundreds of JD Edwards and Viewpoint Vista customers to realize the full potential of their ERP data through the innovative QuickLaunch Analytics QuickLaunch product. Combining decades of business and technical experience working with JD Edwards and Viewpoint Vista data and modern reporting tools such as Microsoft® Power BI, QuickLaunch delivers the framework every customer needs to succeed on their data driven journey. For more information, visit http://www.quicklaunchanalytics.com. [post_title] => QuickLaunch Analytics Celebrates 20th Anniversary by Closing 2021 with Record Increases in Customer Base and Annual Revenue Growth [post_excerpt] => Silicon Valley-based software reporting, analytics, and business intelligence company expands and enhances its QuickLaunch product line to meet increasing marketplace demand. [post_status] => publish [comment_status] => closed [ping_status] => open [post_password] => [post_name] => 20-year-growth [to_ping] => [pinged] => [post_modified] => 2023-05-22 16:40:15 [post_modified_gmt] => 2023-05-22 23:40:15 [post_content_filtered] => [post_parent] => 0 [guid] => https://quicklaunchanalytics.com/bi-blog/ishift-preferred-strategies-partners-copy/ [menu_order] => 0 [post_type] => post [post_mime_type] => [comment_count] => 0 [filter] => raw ) [8] => WP_Post Object ( [ID] => 9685 [post_author] => 10 [post_date] => 2021-11-23 18:52:07 [post_date_gmt] => 2021-11-23 18:52:07 [post_content] => Scottsdale, AZ – iShift and QuickLaunch Analytics have joined forces to seamlessly deliver an innovative cloud-based implementation of QuickLaunch Analytics’ QuickLauch solution. QuickLaunch Analytics has been an innovator and thought leader in the Business Intelligence and Data Analytics space for over 20 years. The QuickLaunch solution is an Information Engine designed to help companies access data that is hard to get to and understand, and turn it into useable information so employees and leaders are equipped to make better decisions that positively impact their business. The QuickLaunch framework is built on the Microsoft Power BI platform and offers cutting edge visualization and analytics functionality across all corporate data sources. The solution allows organizations to access and use their data as a strategic asset to make informed business decisions, increase efficiency, reduce labor costs and gain powerful insights to future opportunities that ultimately make their company more profitable and competitive. The iShift Platform is a comprehensive solution to guide businesses undergoing cloud migration. It encompasses a fully hosted and managed cloud environment and the stack of applications that meet the organization’s needs for value and profitability following the highest security standards, governance, and compliance with applicable regulatory requirements. When a QuickLaunch Analytics client approached them for guidance on best practices in setting up a cloud-based deployment of QuickLaunch, QuickLaunch Analytics brought in iShift as a strategic partner to advise, plan, and design the right Azure cloud environment. As a Microsoft Azure partner, iShift had the knowledge, certifications, and resources to plan and set up the right cloud infrastructure. As a result of the joint project, QuickLaunch Analytics will deploy QuickLaunch on Azure leveraging the iShift Platform. The partnership between the two companies is determined by several factors: the shared values and uncompromising dedication to client success, the focus on transforming technological innovation into a business advantage, and the firm belief that when it comes specific competencies, it makes sense to find the experts that will complement the gaps in know-how. According to Mark Googins, CEO of iShift, “Our teams are passionate about building long-term trusting partnerships with our clients and delivering the competitive advantage they need to grow their business, improve operational efficiencies, and increase profitability. We are very excited to build our relationship with QuickLaunch Analytics for the long-term by offering organizations innovative cloud-based solutions that will help them turn their data into decision ready information.” According to Adam Crigger, Founder and President of QuickLaunch Analytics, “In today’s ever-changing business climate, organizations need to be able to access their enterprise data anywhere anytime. The cloud environment that the iShift Platform offers provides this flexibility. We are continuing our tradition of pursuing strategic partnerships to deliver modern solutions with enhanced capabilities to clients and empower businesses to realize the full potential of their ERP data.”About QuickLaunch Analytics
In order to be successful and competitive in today’s landscape organizations need to easily access, consume and digest corporate wide data and information. QuickLaunch Analytics is an innovative leader in the decision-making business. Our QuickLaunch solution leads to higher data literacy and corporate wide success because our scalable platform provides customers with a governed decision framework model delivering a single source of truth across all data sources…empowering leaders to make strategic, informed and educated business decisions across the organization. We partner with companies to transform their data into meaningful information displayed in customized dashboards, KPI’s, graphs, charts, key metrics, and reports, with the ability to drill down and through the information to clearly identify insights, trends, and outliers. With hundreds of successful customer partnerships, QuickLaunch has been proven to deliver the perfect balance of user friendly and empowering, innovative functionality, near real time data access, and IT governance without the heavy lifting that competitive organizations require to take their companies to the next level of success. At QuickLaunch Analytics we don’t shy away from what is hard, we come right for it, and we succeed! To learn more about how we can help you accomplish your business goals, visit www.quicklaunchanalytics.comAbout iShift
iShift is a multi-cloud technology solutions company that provides cloud engineering, cloud migration, cloud management and specialized IT staffing services. Our mission is to help businesses to simplify and accelerate growth while enabling digital transformation and IT modernization. No matter where organizations are in their cloud journey, iShift can design, build, optimize and manage a future-ready multi-cloud environment, resulting in significant cost savings, increased workforce productivity, operational resilience, continuity of services, and business agility. For more information on how our offerings empower businesses through their adoption of cloud and modern technology, visit www.ishift.net. [post_title] => iShift and QuickLaunch Analytics Partner to Enable Businesses to Make the Most of Their Enterprise Information in the Cloud [post_excerpt] => iShift and QuickLaunch Analytics have joined forces to deliver a cloud-based implementation of QuickLaunch Analytics’ QuickLaunch. [post_status] => publish [comment_status] => closed [ping_status] => open [post_password] => [post_name] => ishift-preferred-strategies-partners [to_ping] => [pinged] => [post_modified] => 2023-05-22 16:40:16 [post_modified_gmt] => 2023-05-22 23:40:16 [post_content_filtered] => [post_parent] => 0 [guid] => https://quicklaunchanalytics.com/?p=9685 [menu_order] => 0 [post_type] => post [post_mime_type] => [comment_count] => 0 [filter] => raw ) ) [post_count] => 9 [current_post] => -1 [before_loop] => 1 [in_the_loop] => [post] => WP_Post Object ( [ID] => 10190 [post_author] => 2 [post_date] => 2022-08-03 13:47:26 [post_date_gmt] => 2022-08-03 20:47:26 [post_content] => [post_title] => Modern Transformation and Analytics Strategies with Power BI for JD Edwards [post_excerpt] => To be successful in today’s competitive landscape, organizations need to maximize profits and customer satisfaction to ensure the company’s annual goals are successfully achieved. Each department must quickly adapt to the day-to-day business challenges to run efficiently and stay ahead of the quickly shifting and impactful business environment. As a result, companies are transitioning from legacy reporting applications to a Modern Analytics and BI platform like Power BI. Although Power BI is a user-friendly technology, companies often struggle to apply it to complex data sources like JD Edwards. [post_status] => publish [comment_status] => closed [ping_status] => closed [post_password] => [post_name] => modern-transformation-and-analytics-strategies-with-power-bi-for-jdedwards [to_ping] => [pinged] => [post_modified] => 2022-10-11 10:02:26 [post_modified_gmt] => 2022-10-11 17:02:26 [post_content_filtered] => [post_parent] => 0 [guid] => https://quicklaunchanalytics.com/resource/how-to-build-interactive-reports-with-quicklaunch-and-power-bi-copy/ [menu_order] => 0 [post_type] => resource [post_mime_type] => [comment_count] => 0 [filter] => raw ) [comment_count] => 0 [current_comment] => -1 [found_posts] => 114 [max_num_pages] => 13 [max_num_comment_pages] => 0 [is_single] => [is_preview] => [is_page] => [is_archive] => [is_date] => [is_year] => [is_month] => [is_day] => [is_time] => [is_author] => [is_category] => [is_tag] => [is_tax] => [is_search] => [is_feed] => [is_comment_feed] => [is_trackback] => [is_home] => 1 [is_privacy_policy] => [is_404] => [is_embed] => [is_paged] => 1 [is_admin] => [is_attachment] => [is_singular] => [is_robots] => [is_favicon] => [is_posts_page] => [is_post_type_archive] => [query_vars_hash:WP_Query:private] => 853252536aa8398b1dfcf7efa4927ca7 [query_vars_changed:WP_Query:private] => [thumbnails_cached] => [allow_query_attachment_by_filename:protected] => [stopwords:WP_Query:private] => [compat_fields:WP_Query:private] => Array ( [0] => query_vars_hash [1] => query_vars_changed ) [compat_methods:WP_Query:private] => Array ( [0] => init_query_flags [1] => parse_tax_query ) )
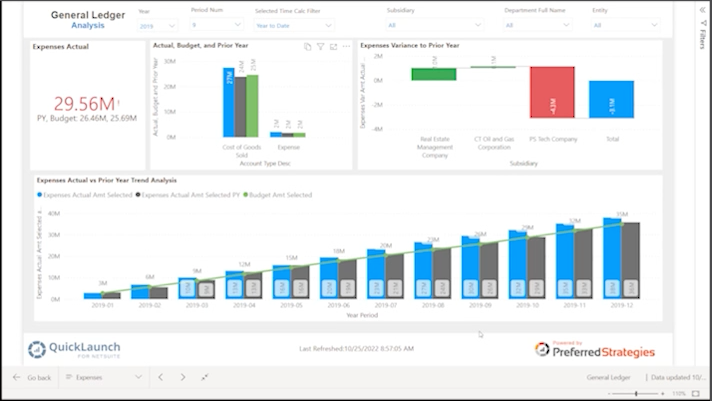
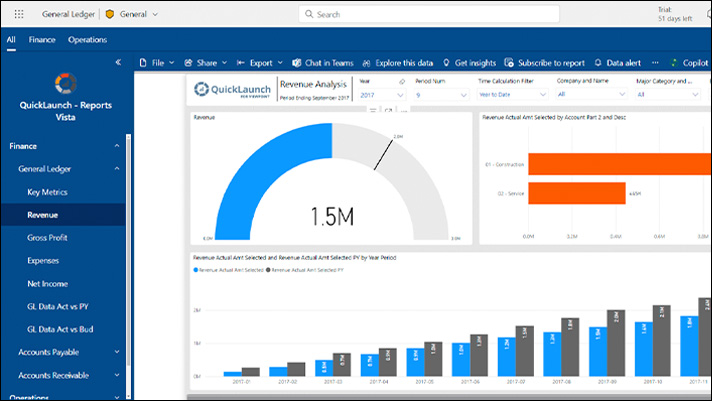
To be successful in today’s competitive landscape, organizations need to maximize profits and customer satisfaction to ensure the company’s annual goals are successfully achieved. Each department must quickly adapt to the day-to-day business challenges to run efficiently and stay ahead of the quickly shifting and impactful business environment. As a result, companies are transitioning from legacy reporting applications to a Modern Analytics and BI platform like Power BI. Although Power BI is a user-friendly technology, companies often struggle to apply it to complex data sources like JD Edwards.
There’s a goldmine of data inside your ERP and CRM systems. But do you have the right tools to transform this into decision-ready information?
Experience firsthand how to use modern BI tools to drive decision-making. Led by QuickLaunch Analytics BI solutions consultant Michelle Werkmeister, you’ll be expertly guided through a series of hands-on exercises and learn how to create your own reports for common business scenarios.

In this Education Session, you will learn how to dig deep into your JD Edwards data and gain a clear understanding of how to stay ahead of your quickly shifting and impactful business environment.
In this educational session you will experience how simple it is to turn your Viewpoint Vista investment into one of your most valuable business assets.
In this educational session you will experience how simple it is to turn your JDE investment into one of your most valuable business assets.

Finance teams often report a lack of confidence in their month-end close. This stressful, time-consuming, error-prone process leads finance teams to spend 80% of their time wrestling with data to reach a deadline and little to no time analyzing the data to deliver true business value.
Learn how QuickLaunch Information Engine can transform your JDE data for month-end close and give you the opportunity to spend more time analyzing the numbers… less time preparing them.

Silicon Valley-based software reporting, analytics, and business intelligence company expands and enhances its QuickLaunch product line to meet increasing marketplace demand.
iShift and QuickLaunch Analytics have joined forces to deliver a cloud-based implementation of QuickLaunch Analytics’ QuickLaunch.