
When selecting a reporting and analytics solution there are several criteria and factors to consider. While the priority of criteria may change by company, the core set of requirements does not.
Five Criteria for Selecting Business Intelligence Software
-
- Ease of Use – The basic premise of self-service analytics, or “Modern BI” as Gartner calls it in their Magic Quadrant, is that business users have the access they need to the data that is important to them, and that the BI tool is intuitive, thus mitigating their reliance on IT. With modern reporting and analytics tools, AI is being introduced to assist the user with Quick Insights and other AI-driven data discoveries.
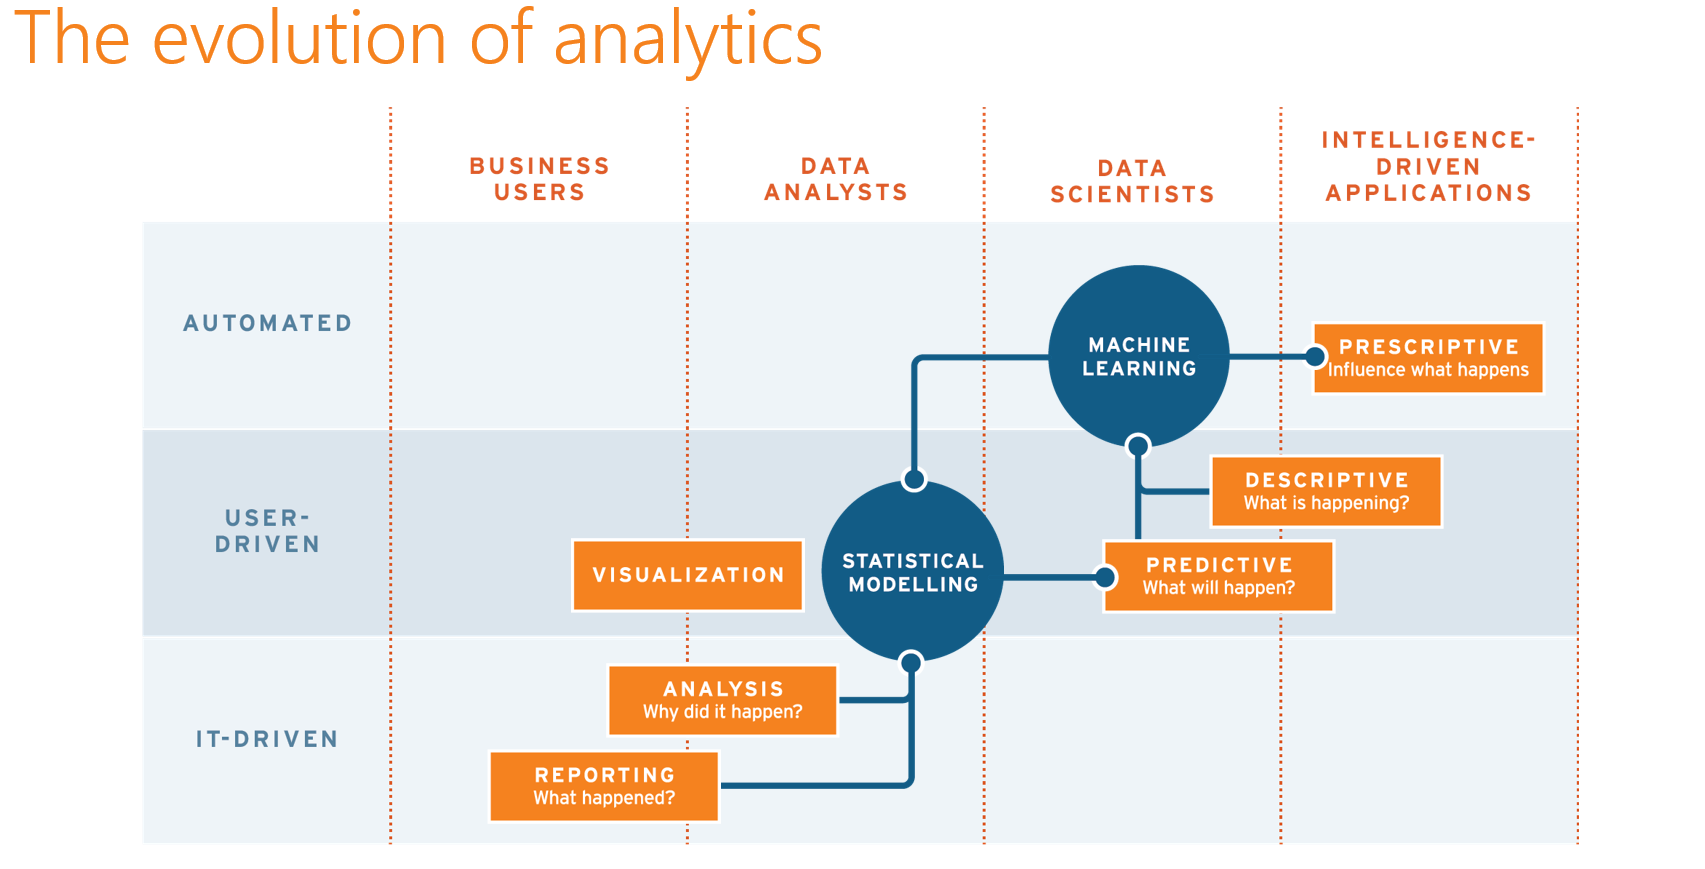
- Standardization – Reporting and analytics have evolved rapidly over the past decade to encompass more than just historical reporting, i.e. what happened last quarter or last month? Visualization of that data to expose trends and other nuanced insights from the data is paramount today in running a business. More recently, predictive modeling and data science have taken on an even more important role around data, i.e. what will happen next month or quarter? Ultimately, a business will benefit greatly by prescriptive analytics, i.e. here’s what we do when this happens, to avoid costly downtime or capitalize on market trends. To educate and train yourself within these principles in hopes of a data science job, there are now many online training courses available such as those provided by Springboard just as one example, already being trained can greatly increase chances of a job offer. Having a single reporting and analytics tool that can help accommodate this journey means you can standardize on a single platform. This will simplify support for data connections and internal training for users at every level.

- Performance – With the adoption of reporting and analytics tools across a wider group of users within the organization, you should find Profit OKR Software or a BI tool that can accommodate many concurrent users and that can scale to meet the demands of complex reports and visualizations. Look for tools that can leverage cloud processing environments to give you that scale independent of on-premise proprietary hardware and software solutions. Migrating your JD Edwards data to the cloud will also provide a streamlined transition to another ERP solution in the future.
- Empower Management – BI reporting and analytics is only valuable if the data can be “consumed” by a wide variety of business users across the organization. Where the C-Suite may require a KPI dashboard to give them a summary of the business performance, individual department heads will want to drill down easily into their respective data to make informed business decisions. Your BI tool should allow for data exploration with an intuitive interface that assists users at all levels of technical knowledge to gain insights independently.
- Integration – JD Edwards has 4,000 tables and 80,000 fields, and is awash with obscure naming conventions that require translation into a meaningful business glossary to let you derive value from the data. Look for a software solution such as QuickLaunch Analytics QuickLaunch to bridge the gap from JD Edwards and give you the widest choice of access to modern BI and reporting solutions with the minimum of integration and support by your IT department or independent systems integrators.
The goal is to choose the software that provides the best balance of capabilities and characteristics that will not only meet your short term requirements, but is also visionary enough to meet your organization’s long-term information goals.


